
Ontario Women’s Intercollegiate Football Association - Improving the Statistics Tracking Experience
Role
Sole UX Designer
Duration
August 2023 - November 2023
Platform
Pencil & Paper, iOS
Figma, Maze, Google Suite
Tools
📉 Problem
Grassroots sporting organizations have difficulty tracking player statistics accurately and efficiently. Having an accurate statistics tracking method can greatly improve player engagement.
📱 Solution
Simplify existing paper & pencil tracking method
Introduce digital tracking method to streamline data collection and allow for seamless integration with future technological advancements in the organization
📈 Impact
Shortening time on task by reducing data entry sections by 43%.
86% in task completion during user testing.
Reduced human error and increased accuracy through digital tracking method redesign
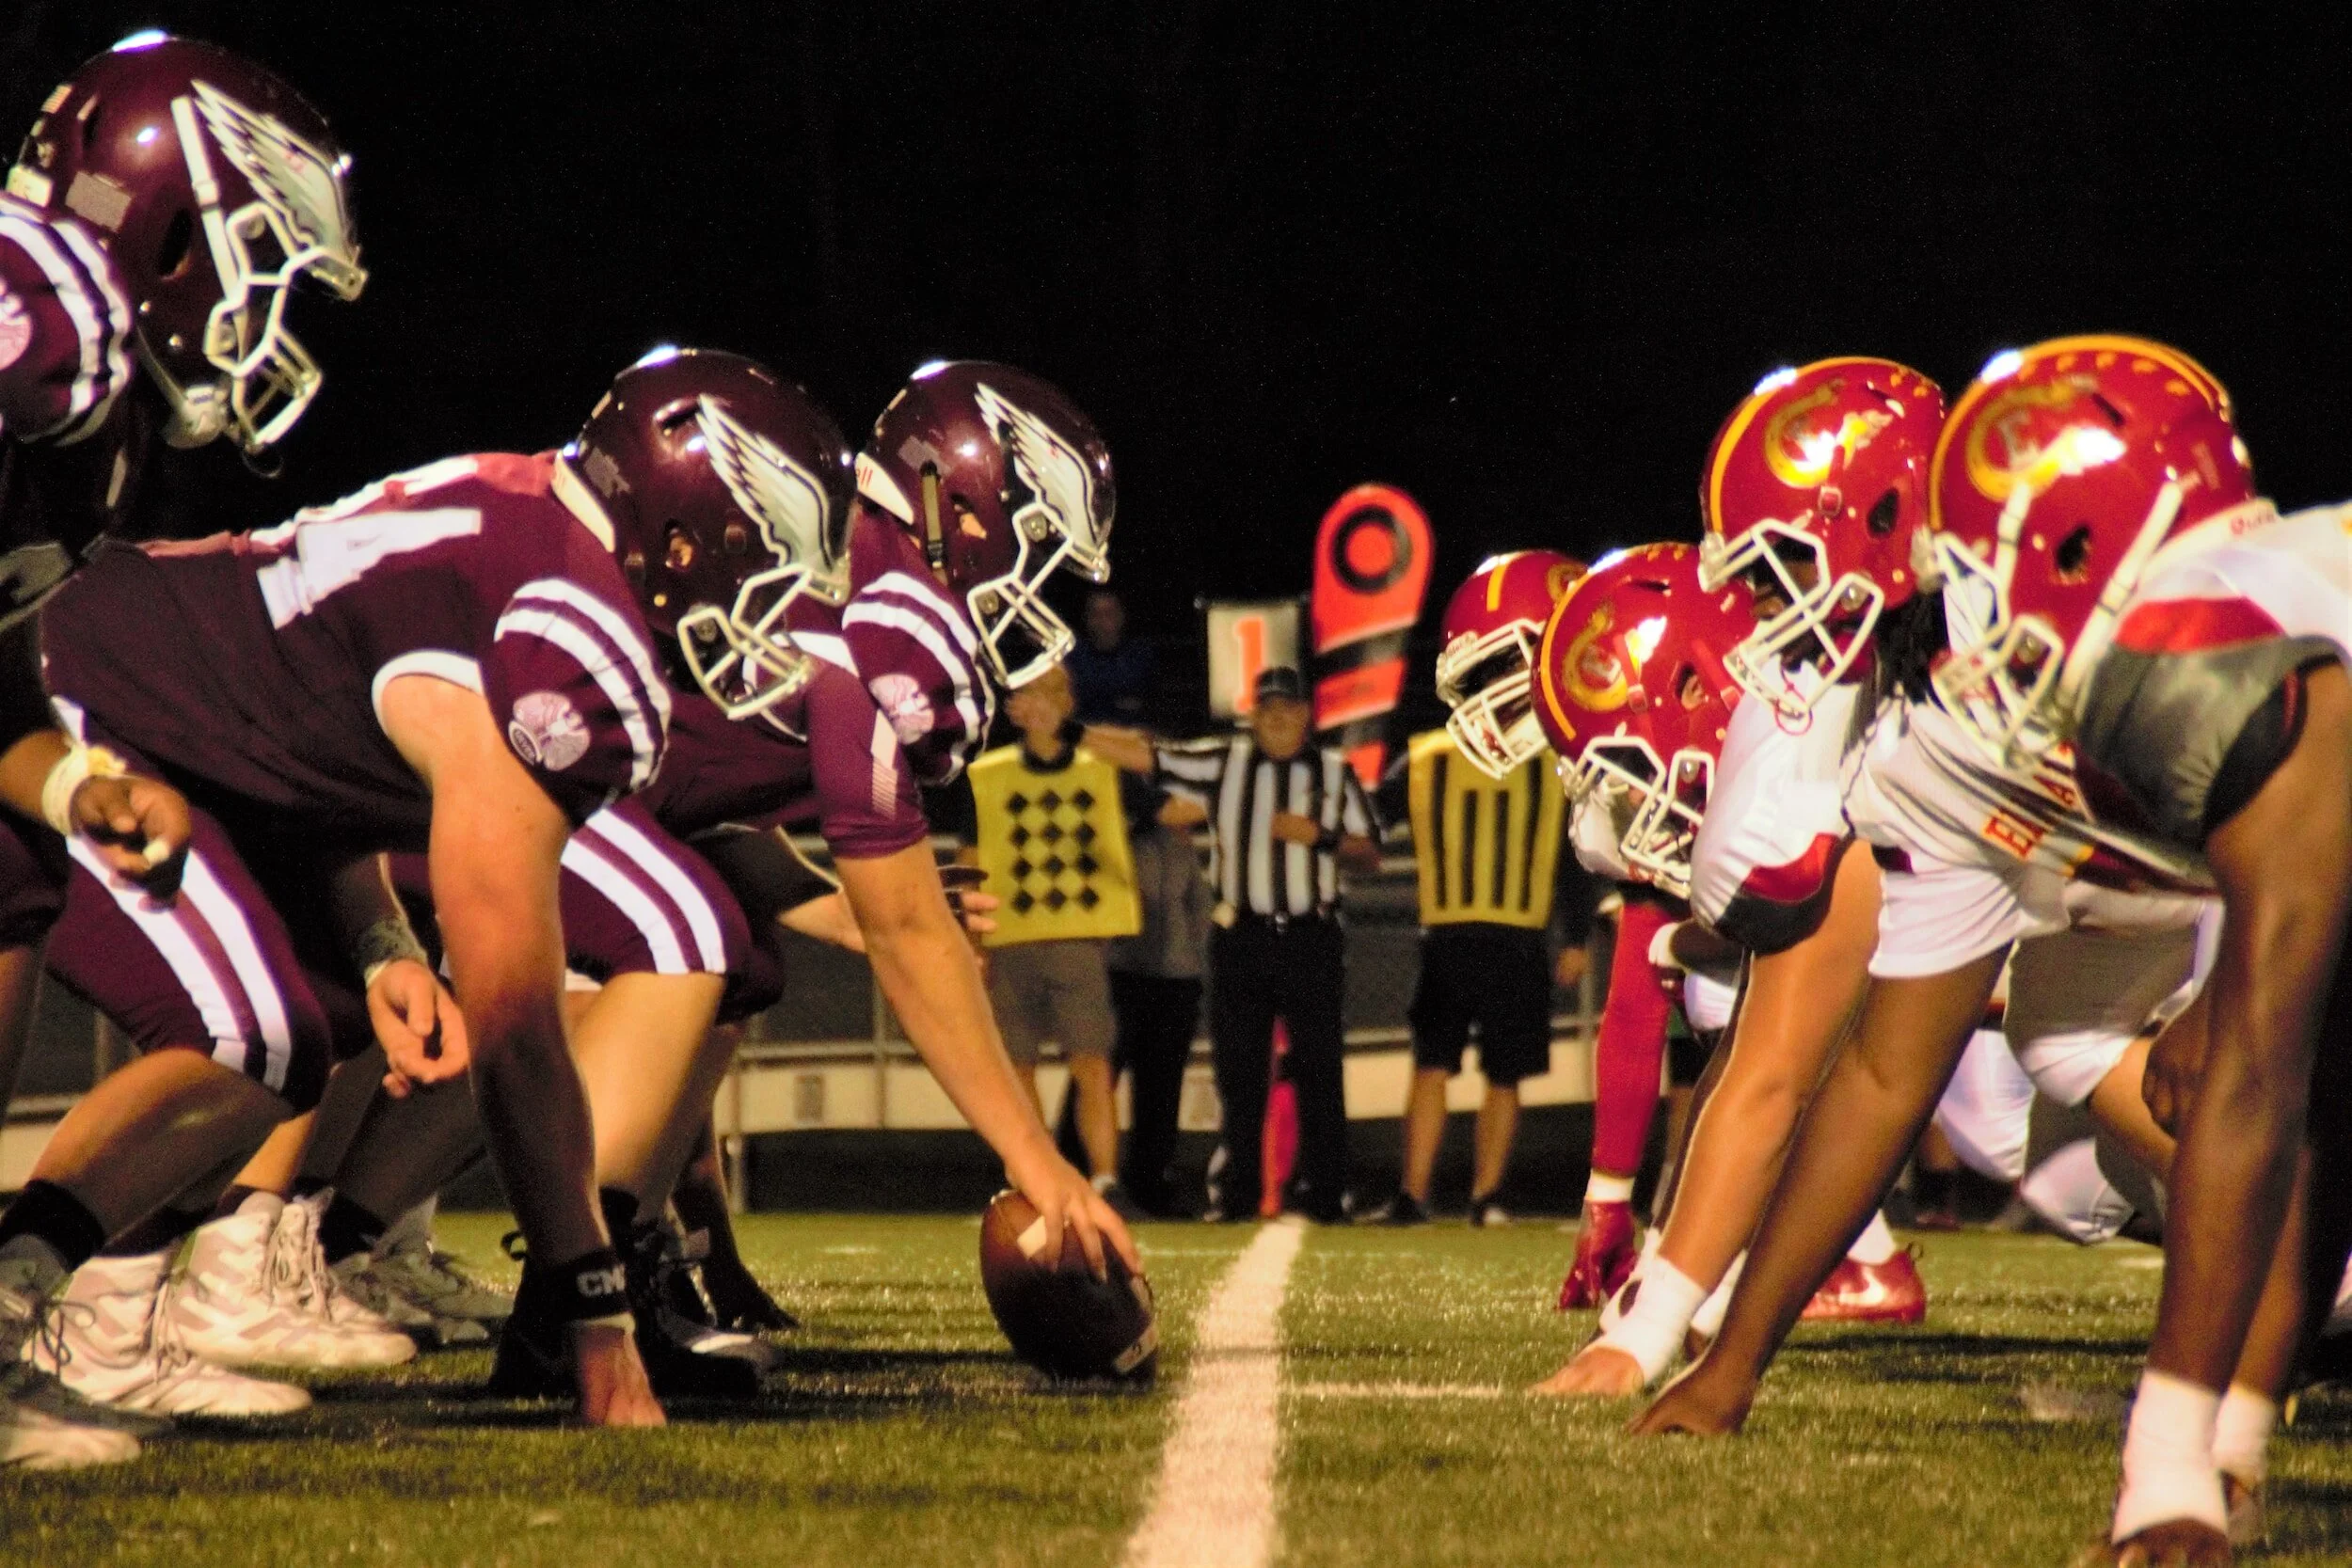
Context
The Ontario Women’s Intercollegiate Women’s Football Association


Constraints
Before considering the design process, it’s imperative to understand the constraints of the problem:
OWIFA plays all its games outdoors, regardless of how cold it can get. Technology shuts off in the cold and a digital solution may not be the best solution.
OWIFA currently utilizes TeamLinkt, a sports management app with a statistics tracking feature. However, this feature lacks user-friendliness. The proposed solution would need to compliment the use of OWIFA’S existing software.
Research Findings
To understand which area of statistics tracking caused the most friction, I conducted ethnographic research and interviewed multiple stakeholders. I narrowed on the pain points of those directly involved with statistics tracking.
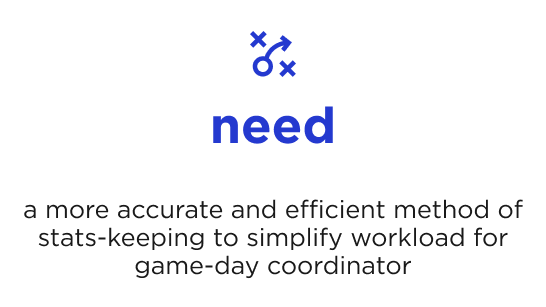
Overall, inefficiency and inaccuracy of statistics tracking was the largest painpoint. Improving this experience would help simplify existing processes for the game-day coordinator - thus allowing them to perform other duties required of them during game days.
Narrowing down on the solution…
I looked at other competitive sport organization’s statistics tracking methods to compare and learned that pencil and paper tracking methods are used in conjunction with digital tracking apps to enhance accuracy. Three similarities between these two tracking methods stood out:
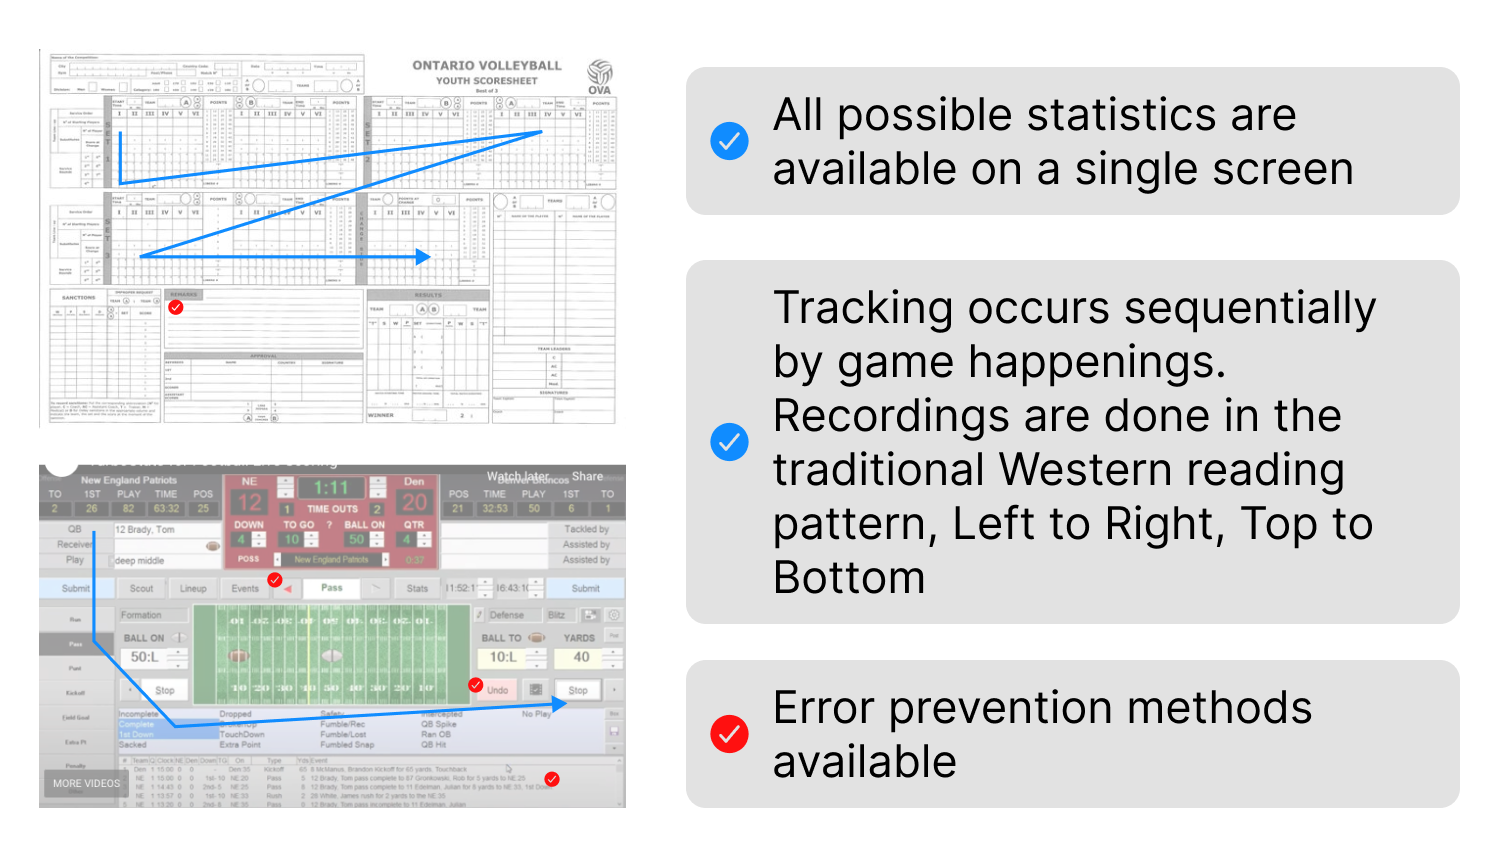
To help jumpstart my ideation process, I knew three things to be true:
Exploring both pencil & paper and digital solutions will allow for user-flexibility while enhancing efficiency and accuracy.
Exploring the sequence of a football game will help inform the IA and UI of both prototypes.
Limited real estate on a phone screen may be challenging to fit all statistics
sketching potential user flow through football game sequence
Sketches
→
Wireframes
→
Heatmapping during usability testing
→
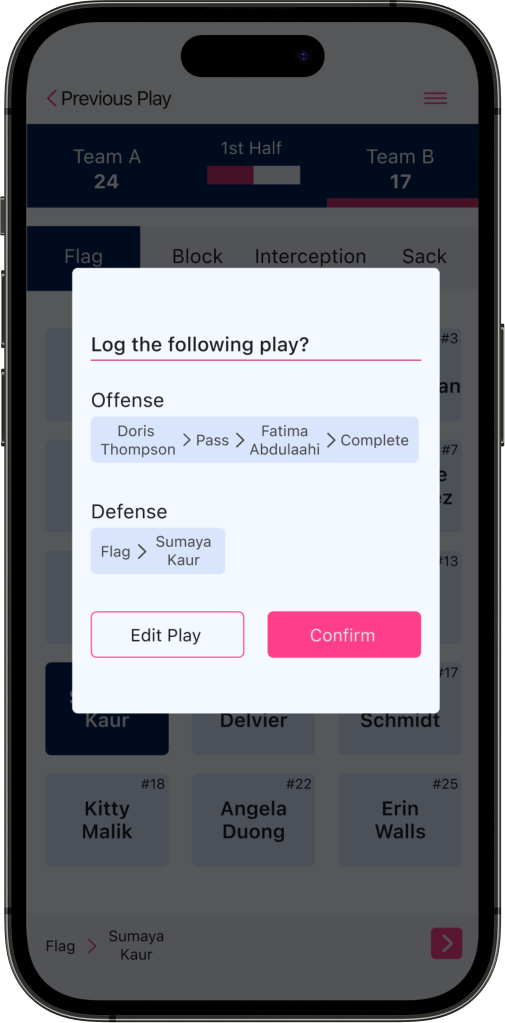
New confirmation modal from usability testing results
The Solution
I spent a lot of time in the sketching process, generating over 10 different variations for a single screen. It was difficult to ensure all the tracking happened on one mobile screen while maintaining the same UI across offense and defensive screens.
Paper & Pencil Tracking
Using the IA, I sequentially logged each stat in columns side by side to mimic the L-R reading pattern. Where information could be deducted from how numbers were tracked (ex. percentages), I removed the column from the original tracking sheet ultimately reducing the number of tracking columns required by 43%.
Final scoresheet design with statistics tracking. It may look like a lot - but all the tracking happens now on one game sheet instead of multiple!
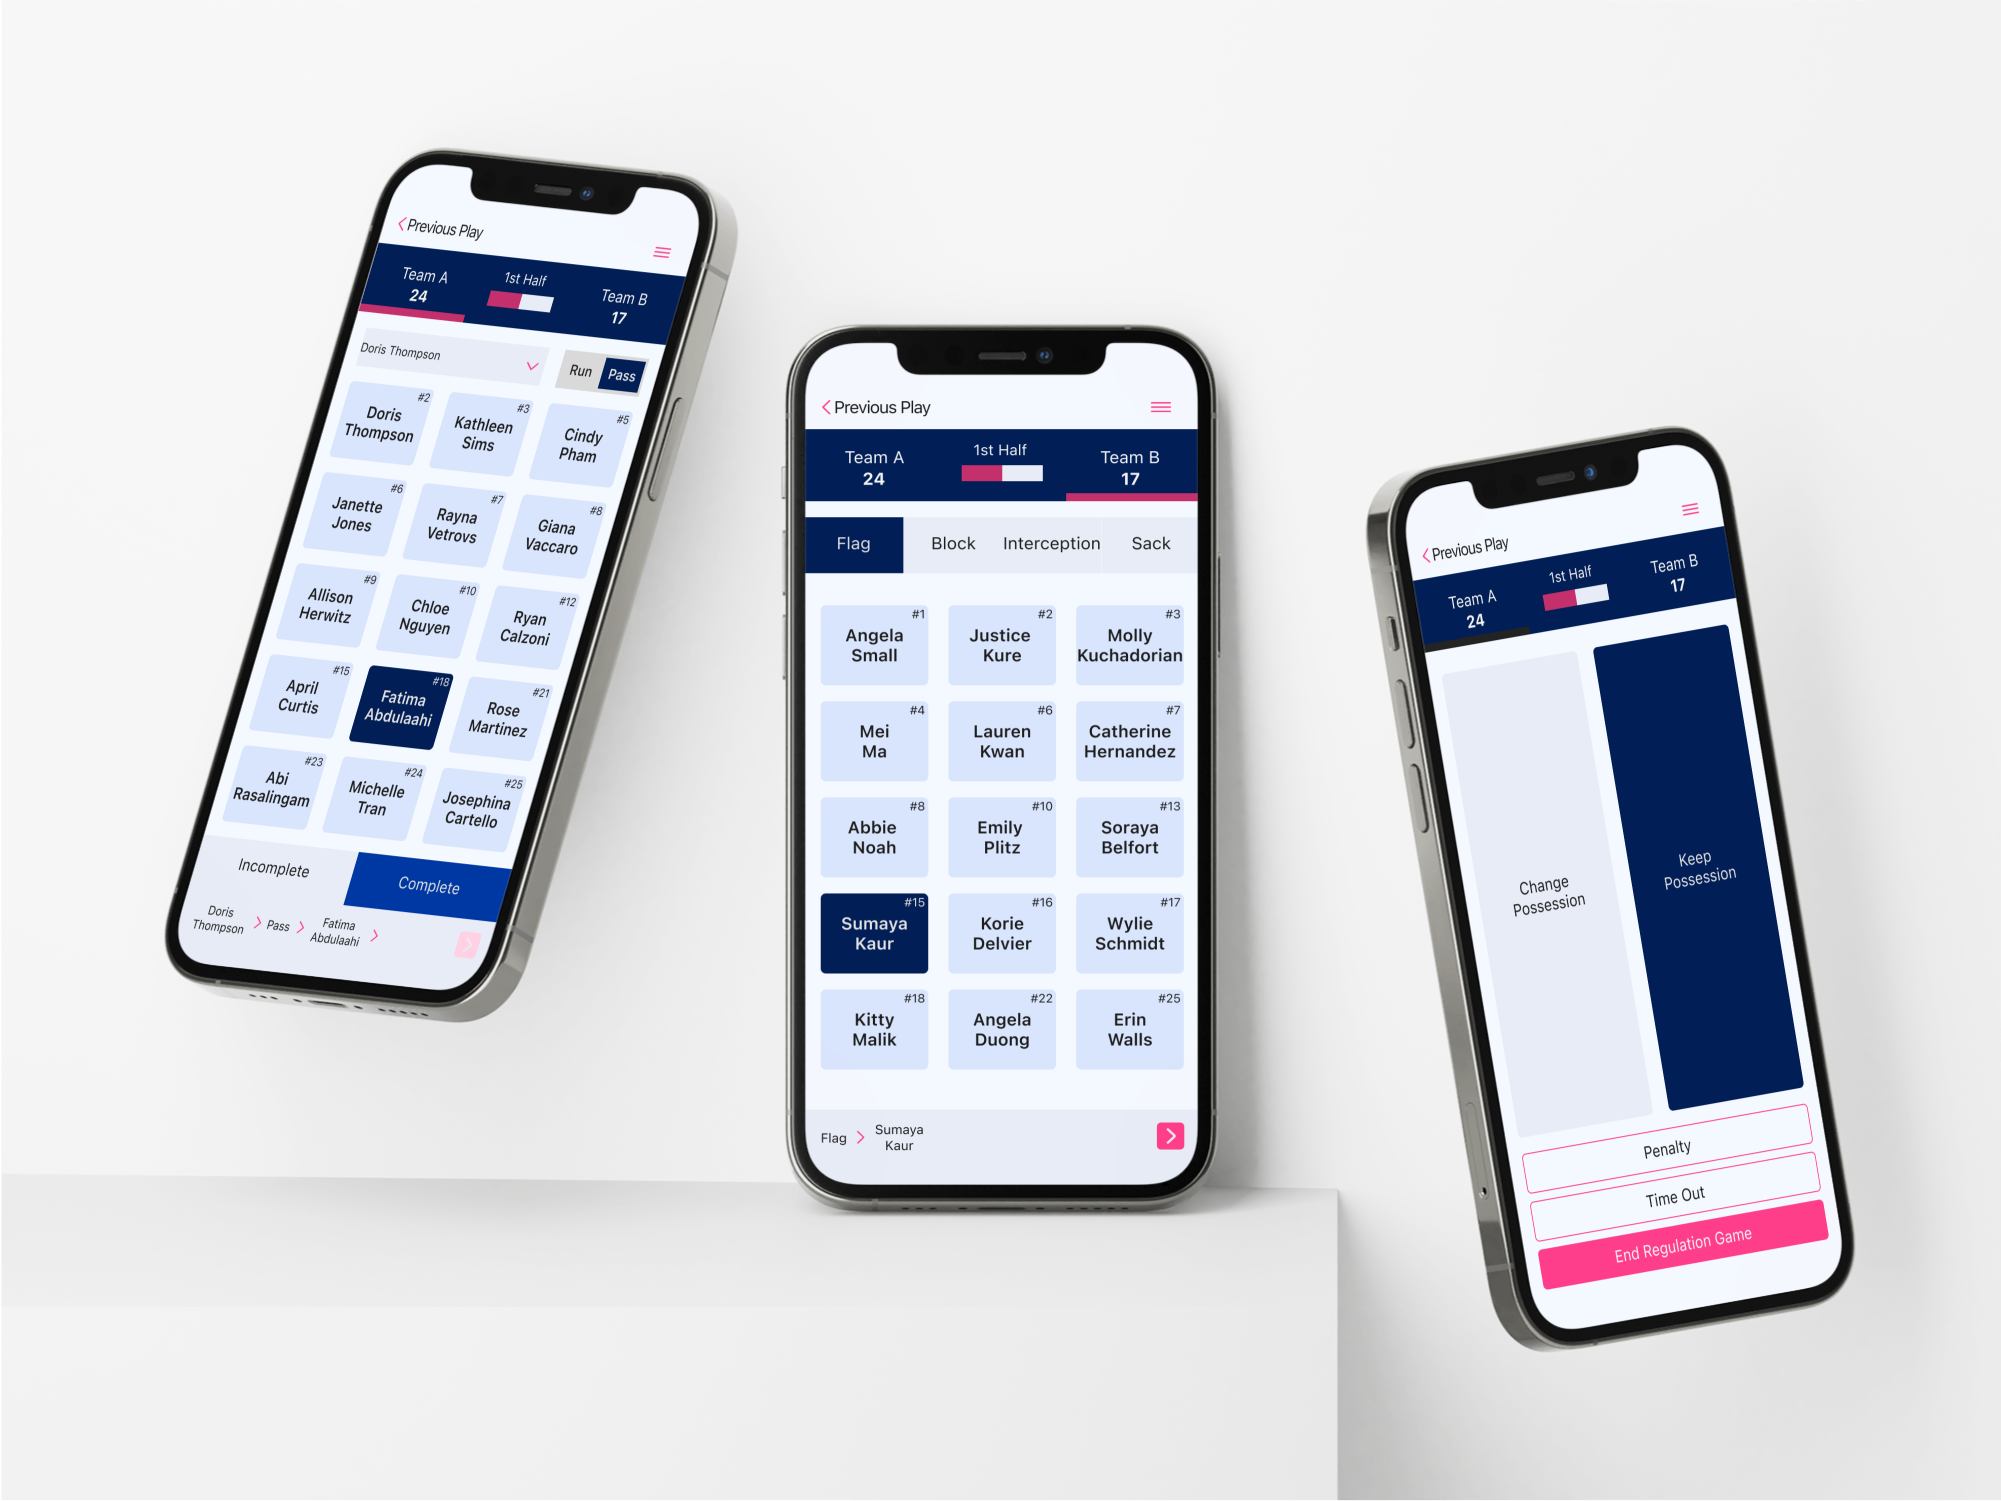
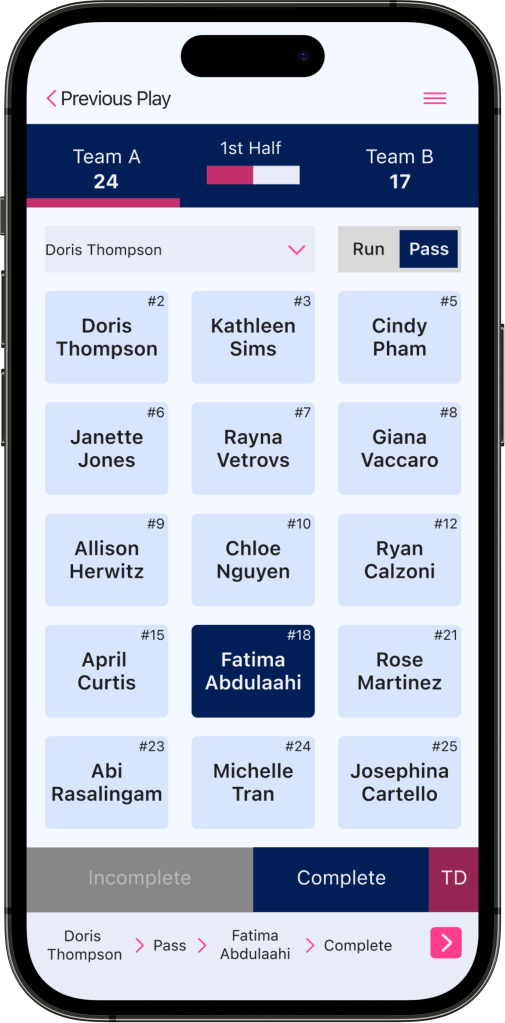
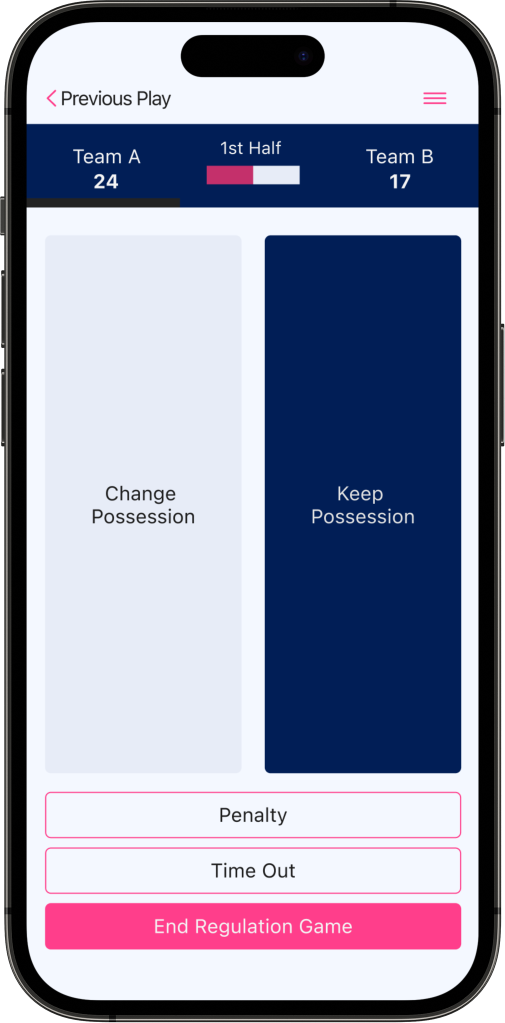
Digital Tracking
The software OWIFA utilizes has users typing in each individual statistic. The prototype utilizes buttons instead for users to easily tap, reducing human error involved. Error prevention methods were included in the design using active/inactive states, selection previews, and previous play methods.
Impact
⚡️ Improved efficiency using a synthesized current pencil & paper method
Reduced data entry sections by 43%.
Existing scoresheets were combined onto one stat-tracking sheet and 16 unique stat-tracking columns were consolidated into 7 with no statistics compromised
Completing one sheet would improve efficiency and reduce time on task.
🎯 Improved accuracy using a digital solution
Digital solution showed 86% increase in task completion during user testing.
Utilizing buttons instead of individually typing in numbers would improve accuracy and reduce time on task.
Next Steps
Design the UI and develop the back-end processes using the clicked buttons to provide basic play-by-play game summaries, team/athlete statistics.
Craft the information architecture further to explore other flows (ex. penalties, down and distance)
Conduct benchmarking testing to improve on product capabilities
←
Website Redesign